13K
Life MemberLife Member
13K

PostJul 30, 2022#251

Another billion dollar year!
Stl Building Permits Billion 2022.png (181.54KiB)

6,118
Life MemberLife Member
6,118

PostJul 31, 2022#252

^Are those through July, or yearly totals? If totals, dang, we're doing well. (I suppose the cranes speckling the western sky are an indication that this might be the case.)

13K
Life MemberLife Member
13K

PostJul 31, 2022#253

Yearly totals.

6,118
Life MemberLife Member
6,118

PostAug 01, 2022#254

^Sweetness! Gotta love it. :)

1,020
Expert MemberExpert Member
1,020

PostAug 02, 2022#255


Accelerating STL multifamily deliveries per CW


Sent from my iPhone using Tapatalk

9,541
Life MemberLife Member
9,541

PostAug 02, 2022#256

^ metro data?

5,704
Life MemberLife Member
5,704

PostAug 04, 2022#257

quincunx wrote:
Jul 30, 2022
Another billion dollar year!
Stl Building Permits Billion 2022.png
So what projects/additional permits might help tip this above $1.3 bill for the year

1) Convention Center Phase II permits?
2) Koplar's Kingshighway & Lindell?
3) FPP & Vande - student housing/apartment mixed use not seeking tax abatements (believe)?
4) a few more mixed use residential projects, either seeking approval or abatements, say Optimist or Cortex M, etc.??

13K
Life MemberLife Member
13K

PostAug 04, 2022#258

There's a $75.886M one for the Siteman Ambulatory Cancer Center permit not yet issued.

9,541
Life MemberLife Member
9,541

PostAug 12, 2022#259


These 7 neighborhoods account for 14.04% of the City population. Racial make up of the 7 as a whole is 50% white, 32% Black, 10% Asian, 9% other another way is looking at it is 86% of the City lives in neighborhoods that saw 31% of development since 2017

13K
Life MemberLife Member
13K

PostAug 25, 2022#260

Over $1.1B for 2022. There's over $600M in submitted (2020, 2021, 2022), but not issued permits.

PostNov 10, 2022#261

This year has surpassed all of 2021. Yes, there has been inflation. We all know.
Screenshots_2022-11-09-18-30-52.png (153.65KiB)

240
Junior MemberJunior Member
240

PostNov 10, 2022#262

quincunx wrote:This year has surpassed all of 2021. Yes, there has been inflation. We all know.
Screenshots_2022-11-09-18-30-52.png
I know I’m probably asking for too much but we should upload tables with inflated and un inflated numbers so most of the people that doesn’t understand inflation could see the difference and make comparisons. But again I’m probably asking of people’s extra questions time and is just a suggestion. Lol.


Sent from my iPhone using Tapatalk

sc4mayor
sc4mayor

PostNov 10, 2022#263

^ This table is generated from the Building Division website.  It does not include inflationary data.

9,541
Life MemberLife Member
9,541

PostNov 10, 2022#264

you can apply the standard inflation to that by multiplying the 1.292billion by .92 but it doesn't do any good, there are many unknown factors like when building materials were secured, does the labor contractor have a long term relationship with client (ie Tarlton and WUSTL) either way, number of permits isnt down compared to last year which would indicate less projects that now cost more. 

PostNov 10, 2022#265

btw its up to $1.32 billion now. 

Average permit value is $271,992 this year vs $230,000 last year, so about 18% increase. 

some quick math would suggest about $1.50B by end of the year to be equal to last year and the pace right now is $1.55-1.6B

PostDec 17, 2022#266

2021 data;

Kansas City, Which is about 320 square miles had $1.42billion in building permits compared to $1.3b in STL city, which is 62 square miles

Per sq mi bases
KC- $4,375,000
STL- $20,967,741

3,541
Life MemberLife Member
3,541

PostDec 17, 2022#267

dbInSouthCity wrote:
Dec 17, 2022
2021 data;

Kansas City, Which is about 320 square miles had $1.42billion in building permits compared to $1.3b in STL city, which is 62 square miles

Per sq mi bases
KC- $4,375,000
STL- $20,967,741
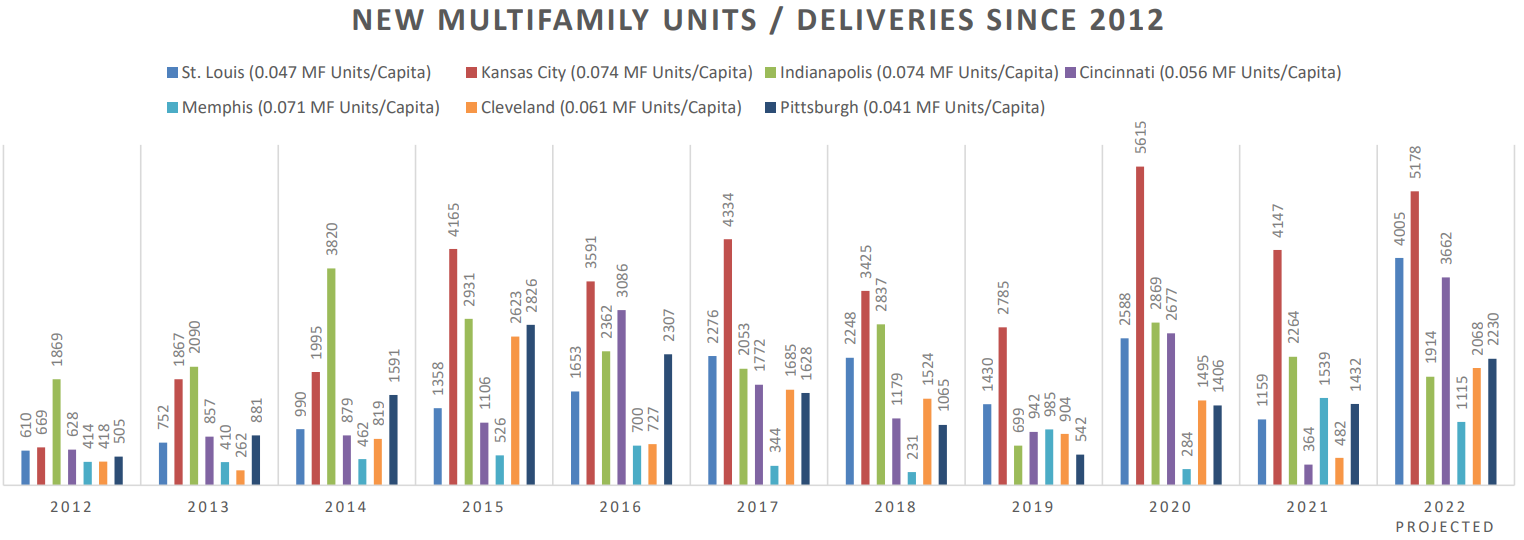
Seems like St. Louis had higher per capita investment too. It will be interesting to see if the city can keep up the momentum. I have a feeling the city may finally be at a tipping point. Obviously, infrastructure and crime are two major issues holding it back.

sc4mayor
sc4mayor

PostDec 17, 2022#268

Has anyone ever made an effort to track building permits in St. Louis County?  Obviously fragmentation makes that really difficult, but presumably St. Louis County has the unincorporated data somewhere…

I did manage to find Clayton's data for FY21 (only thru September 30th).  417 permits with a total value of $129,995,411.  A down year after 2020 (~$279 million) and 2019 (~$333 million).

13K
Life MemberLife Member
13K

PostDec 18, 2022#269

Thanks for finding the Clayton data. Link?

I don't think the county puts such data online.

Here's KC's data portal. 2010-21 they issued $14.076B worth, while STL had $8.78B. Factoring population or land area shows STL doing well in comparison.

https://data.kcmo.org/stories/s/Buildin ... /sq5v-m7n2

sc4mayor
sc4mayor

PostDec 18, 2022#270

Clayton’s is in their comprehensive annual financial report. I’d imagine other municipalities are probably similar, unfortunately not all of them make it so easy to find lol.
https://www.claytonmo.gov/home/showpubl ... 3236670000

Permit data is on page 104.

2,430
Life MemberLife Member
2,430

PostDec 18, 2022#271

Kansas City fortunately has a break down of permits by school district. (There's about a dozen districts at least partially within Kansas City.) And that allows for a much better apples-to-apples comparison with STL City.


13K
Life MemberLife Member
13K

PostJan 04, 2023#272

NextSTL - $1.4 Billion in Building Permits Issued in 2022

https://nextstl.com/2023/01/1-4-billion ... d-in-2022/

1,518
Totally AddictedTotally Addicted
1,518

PostJan 06, 2023#273

https://stlhba.com/Common/Uploaded%20fi ... Report.pdf

Nov numbers from HBA - The city is doing well - probably fall just short of last year for new construction 

But the most interesting thing is the StL County increasing (slightly) for single families while St. Chuck is down slightly 

The city and county added together is about equal to St. Chuck - which probably has not happened in decades - Not sure what it means, but interesting 

5,704
Life MemberLife Member
5,704

PostJan 06, 2023#274

^ t think the County/City vs St Charles comparison definitely has some dynamics at play.  

Start with the fact that City/County by population & job development should have had more single family then it has been so clearly underperforming but I believe in last couple of years you have same decent sized parcels at more favorable land values and probably by perception open up for development (say around Chesterfield, or the old S County insurance campus, Crestwood, so on) as well as city land/property values nil so an uptick as of recent from a low bar.   Where as St. Charles/Exburbs single family is almost exclusively hinged on the mortgage interest rates for which it makes sense that the marked is finally down after some robust years.

Not sure Beer city if this is what your getting at with my next comment.  But I do think it is interesting in the trends might suggest the migration farther and farther out is not really or nearly as relevant to the single family residential market for the region as it used to be.  A good thing.  

sc4mayor
sc4mayor

PostJan 06, 2023#275

Also worth mentioning that many county municipalities do not report permit data. The HBA stats are not necessarily correct.

Read more posts (122 remaining)